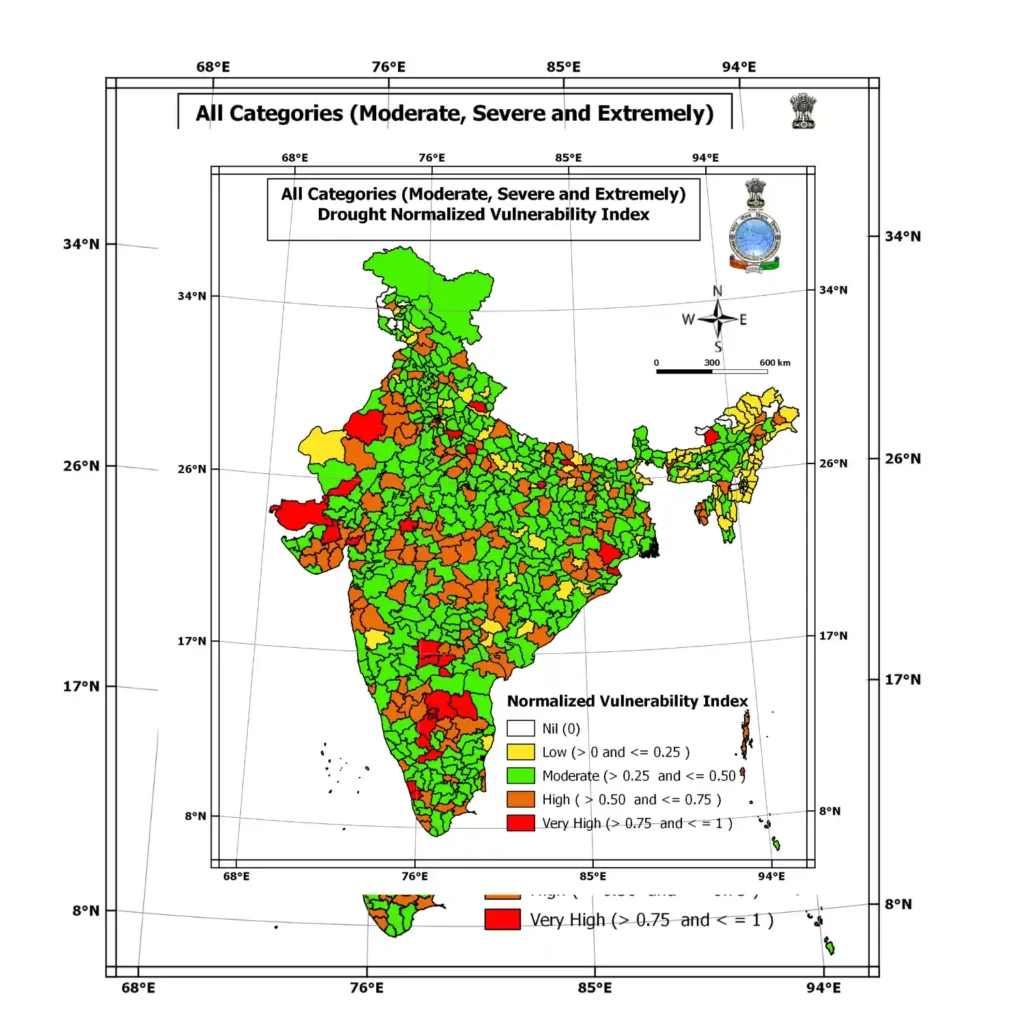
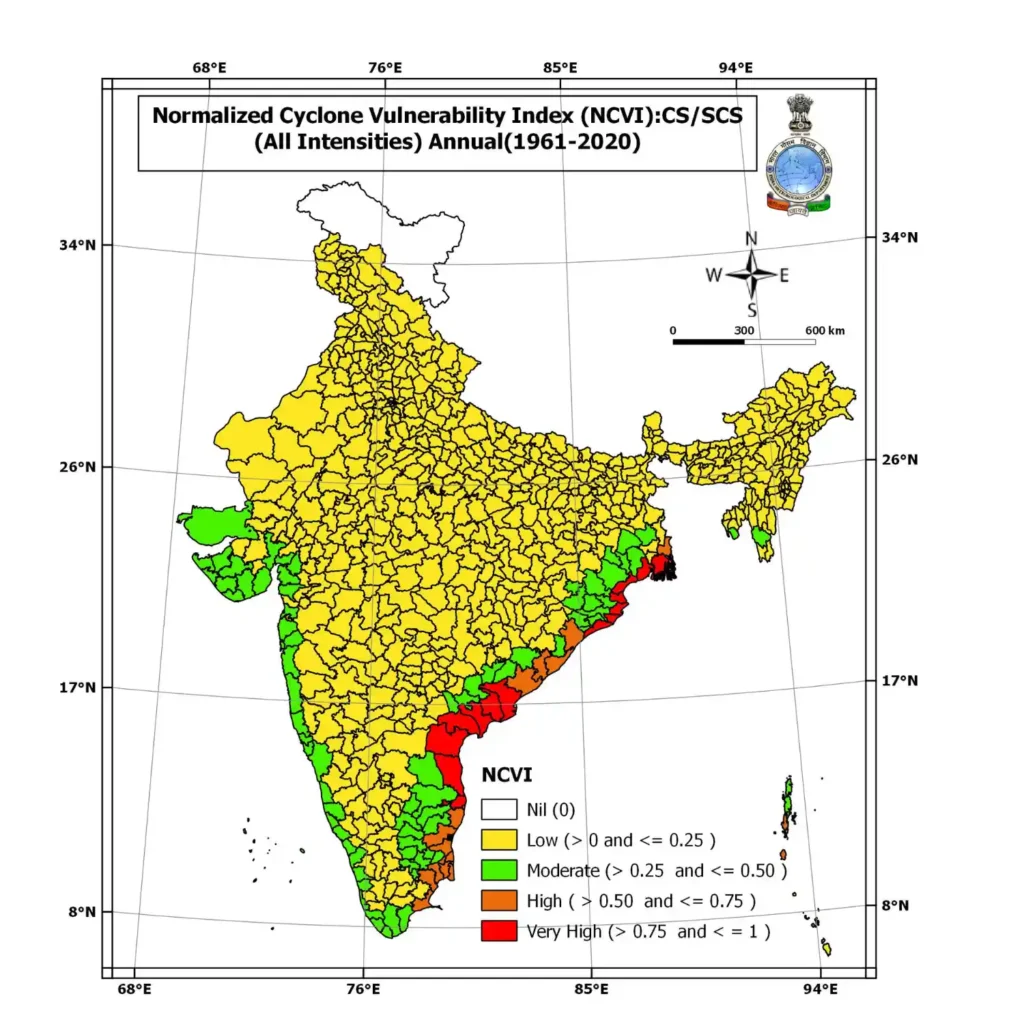
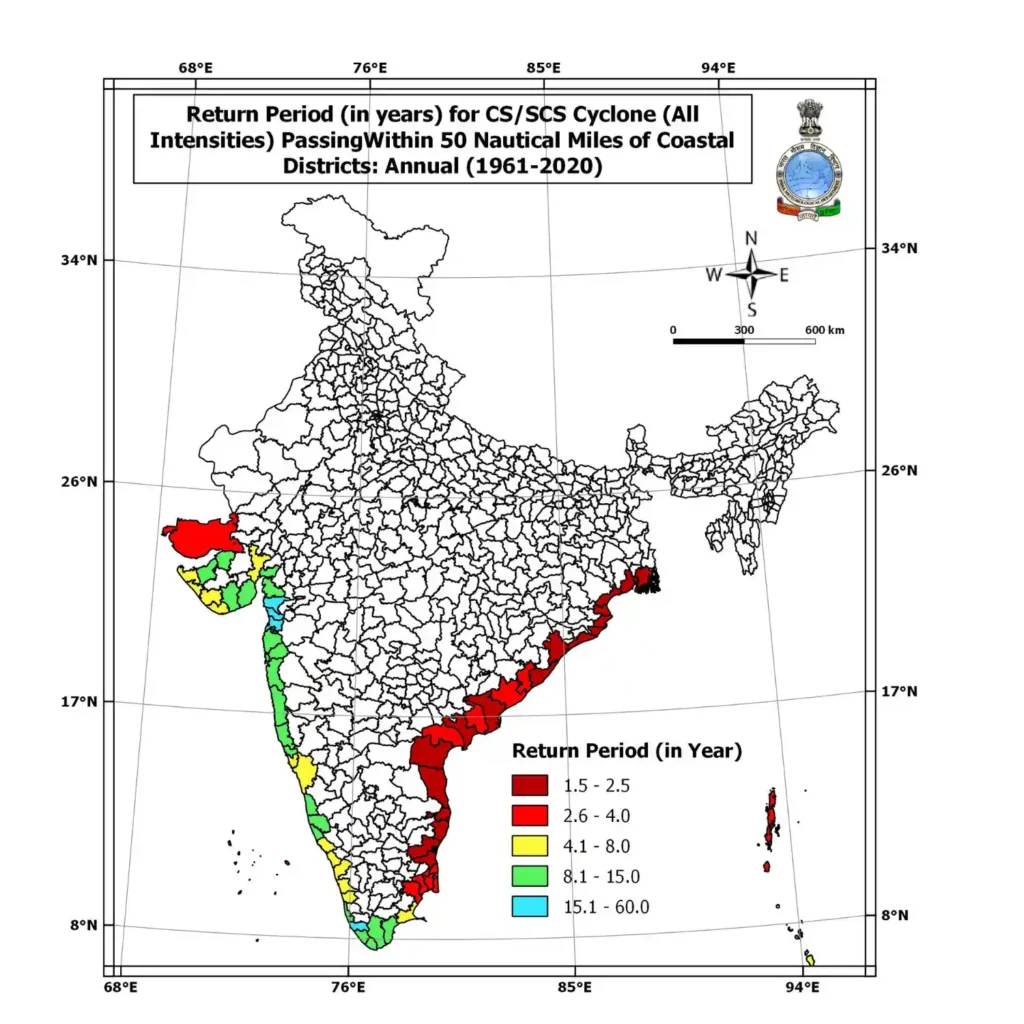
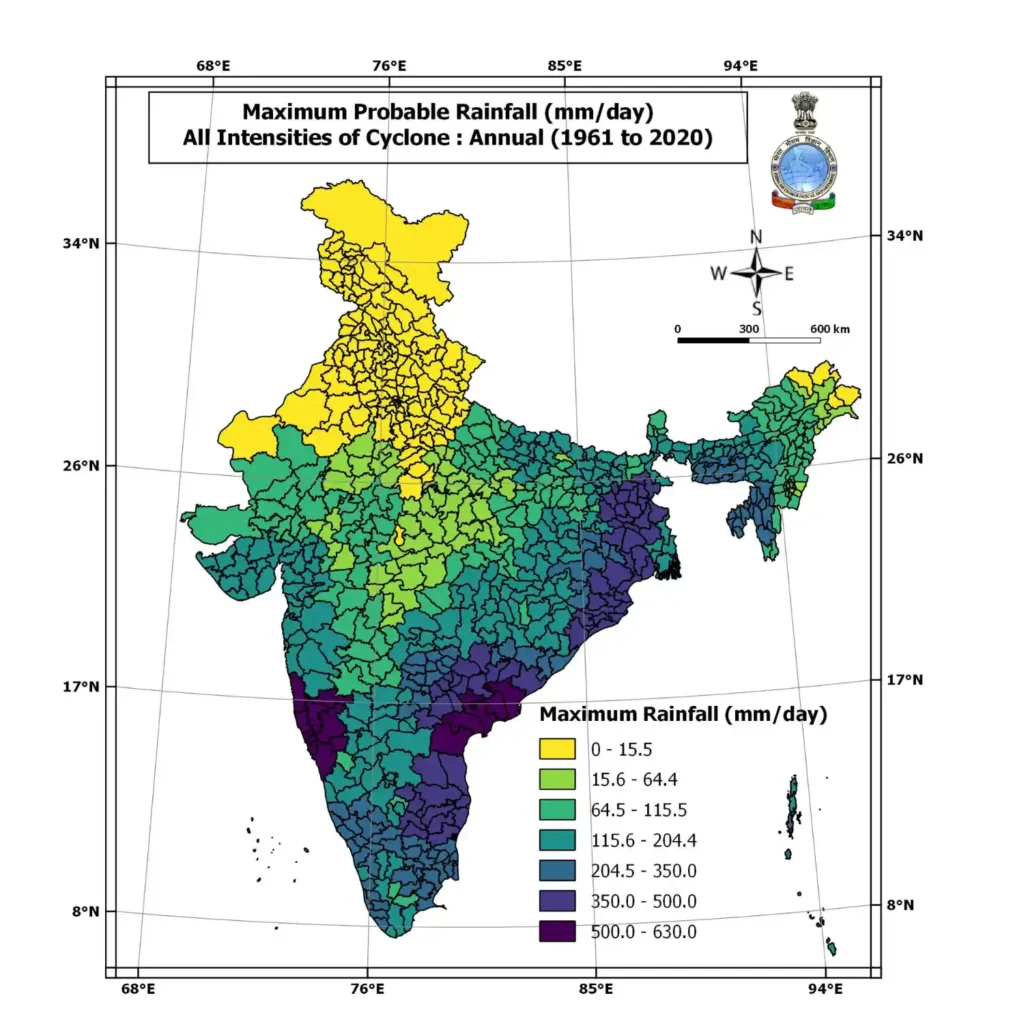
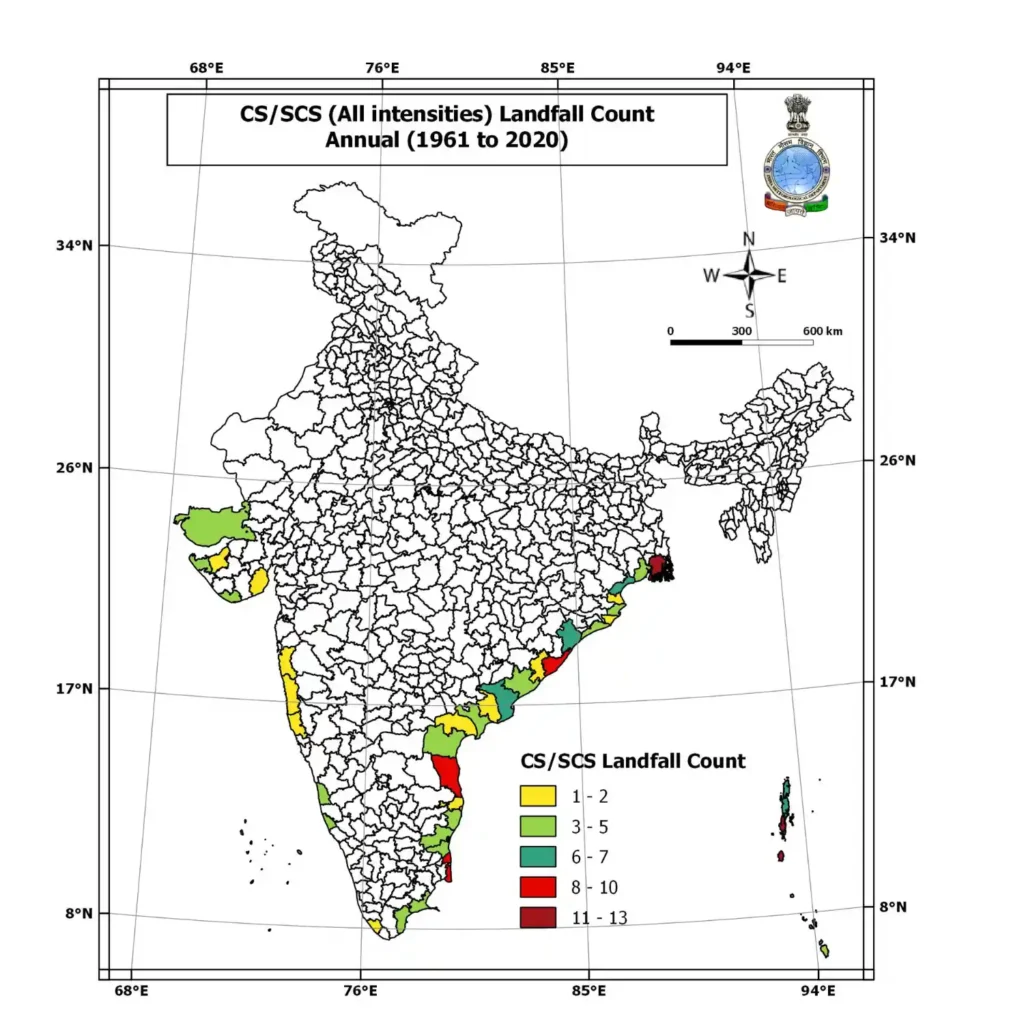
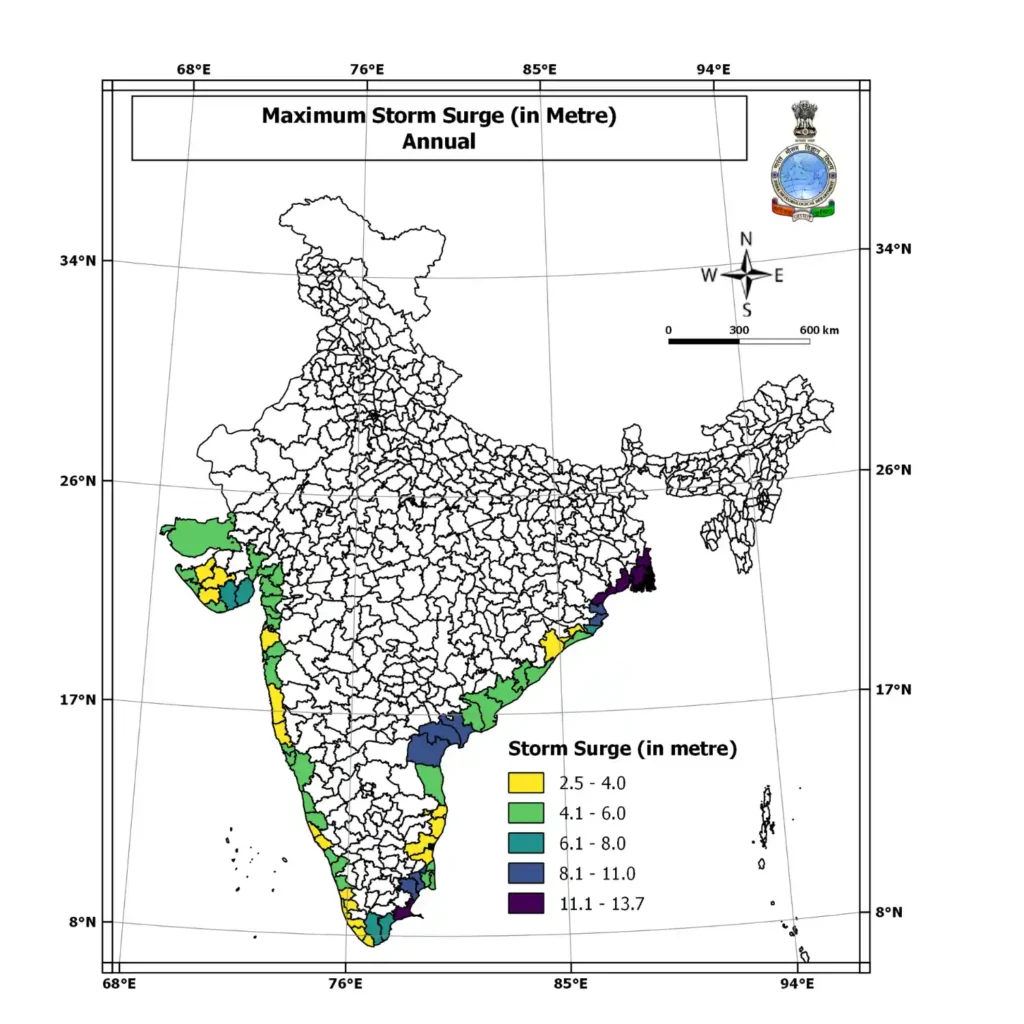
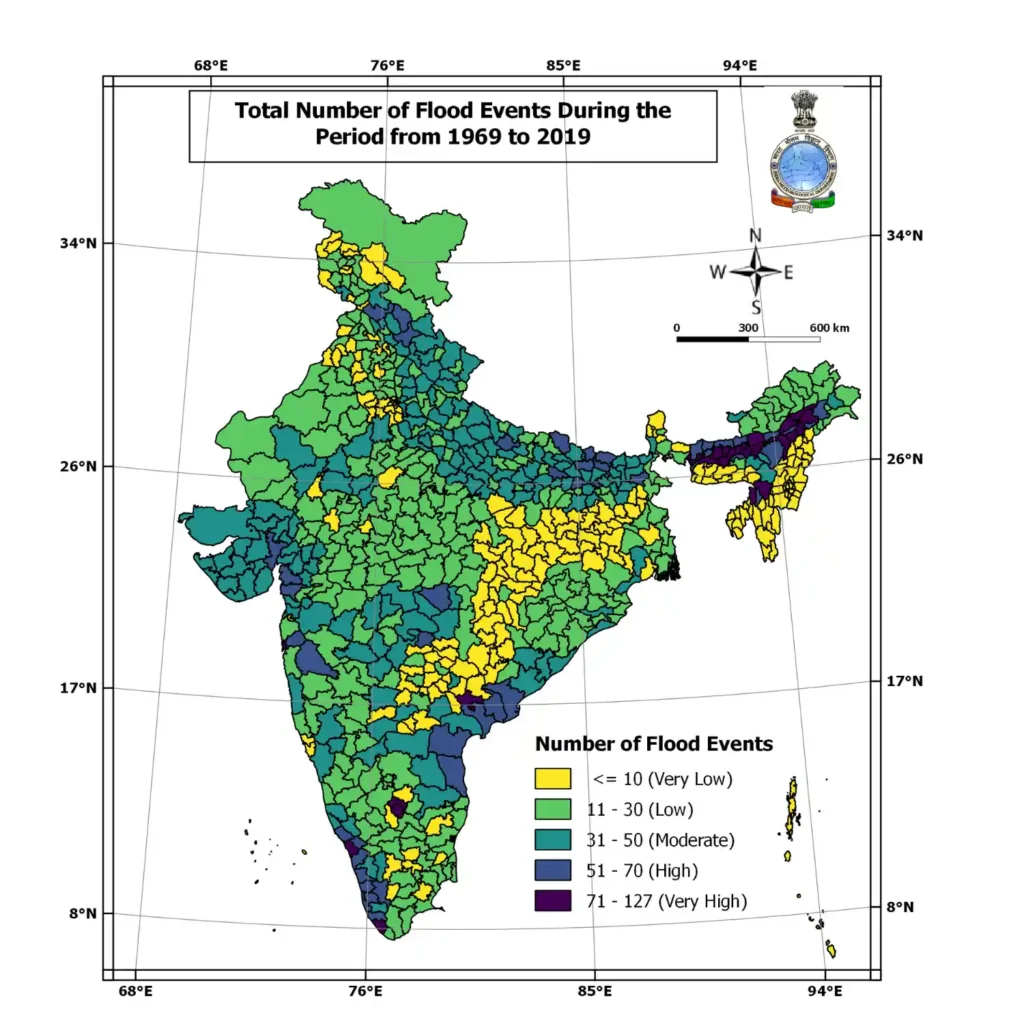
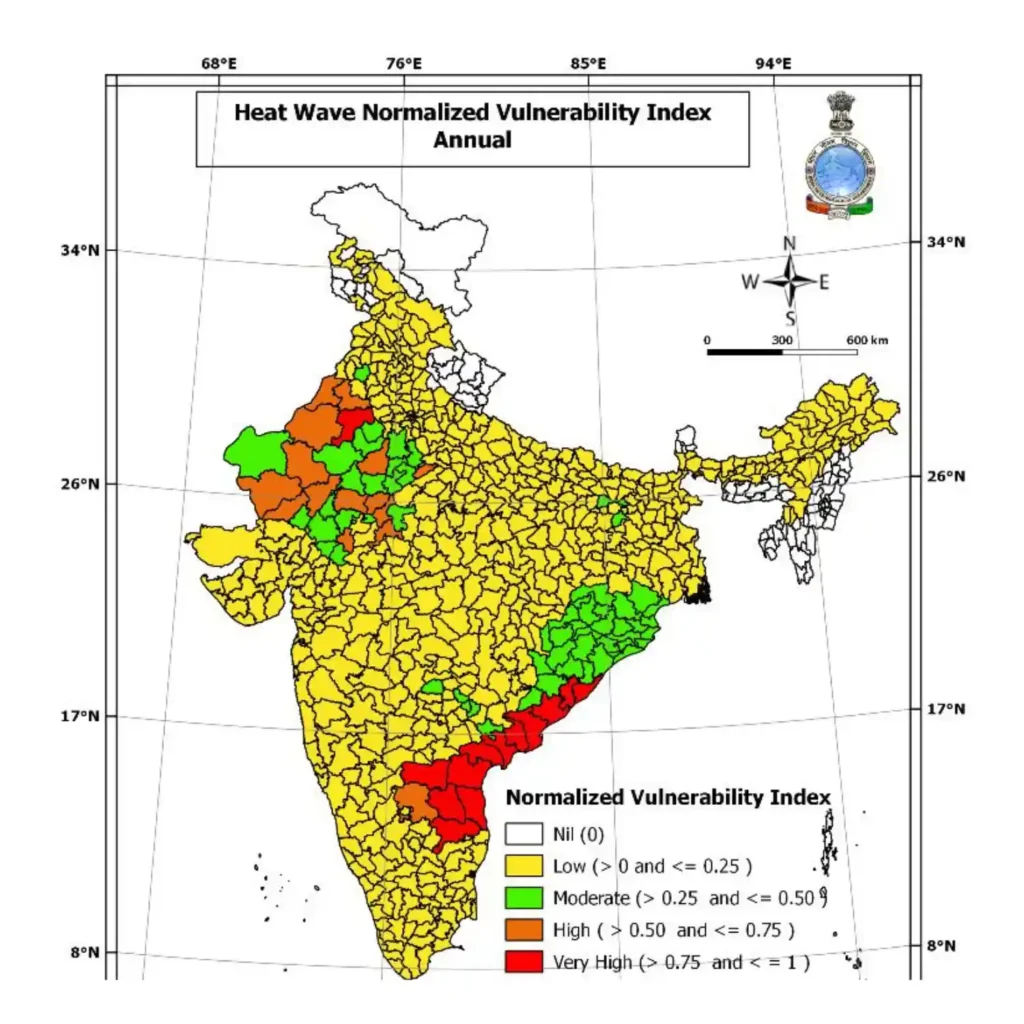
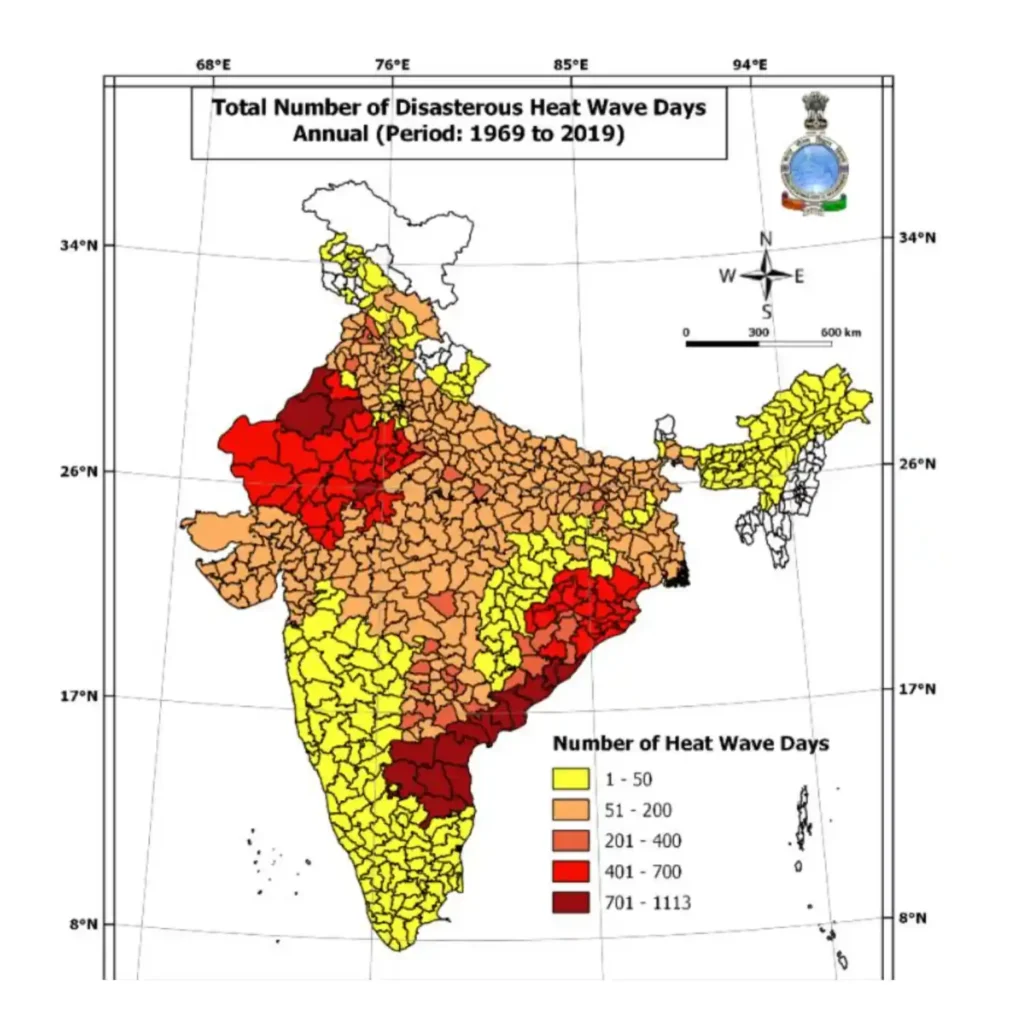
Gain insights into the intricate relationship between greenhouse gas (GHG) emissions and extreme weather risks with our comprehensive climate vulnerability indices. Focused on flood, drought, cyclone, and heatwaves, our indices provide a detailed examination of how GHG emissions contribute to the vulnerability of communities and ecosystems to these climate-related hazards.
Floods, droughts, cyclones, and heatwaves are among the most pressing challenges faced by societies worldwide, exacerbated by the increasing concentration of GHGs in the atmosphere. Our climate vulnerability indices sourced from IMD offer a multidimensional analysis of these risks, integrating GHG emissions data to provide a holistic understanding of vulnerability.
By assessing exposure, sensitivity, and adaptive capacity across different climate hazards, our indices empower stakeholders to identify vulnerable regions, prioritize interventions, and allocate resources effectively. Whether you’re a policymaker, researcher, or community leader, our indices offer actionable insights to enhance resilience and mitigate the impacts of extreme weather events.
With a focus on GHG emissions as a central driver of climate vulnerability, our indices underscore the urgent need for mitigation efforts to reduce emissions and limit the frequency and severity of extreme weather events. By addressing GHG emissions at their source, we can mitigate the risks posed by floods, droughts, cyclones, and heatwaves, safeguarding communities and ecosystems for future generations.
Join us in the fight against climate vulnerability by exploring our climate vulnerability indices today. Together, we can leverage data-driven insights to build resilience, adapt to changing conditions, and create a more sustainable future for all.

Understand what's happening near you.
Know how your country, city and district’s climate vulnerability index that evaluates the vulnerability of the human population in that area to extreme climate events and changes in climate over the next 30 years. This would help you in taking informed climate action decisions by adopting customized area-specific solutions
Country wise Emission


State Vulnerability Index
| State | Overall Vulnerability Index Score | Rank |
|---|---|---|
| Assam | 0.616 | 01 |
| Andhra Pradesh | 0.483 | 02 |
| Maharashtra | 0.478 | 03 |
| Karnataka | 0.465 | 04 |
| Bihar | 0.448 | 05 |
| Manipur | 0.424 | 06 |
| Rajasthan | 0.423 | 07 |
| Arunachal Pradesh | 0.408 | 08 |
| Sikkim | 0.370 | 09 |
| Odisha | 0.368 | 10 |
| Nagaland | 0.365 | 11 |
| Tamil Nadu | 0.339 | 12 |
| Himachal Pradesh | 0.329 | 13 |
| Jammu & Kashmir | 0.328 | 14 |
| NCT Delhi | 0.290 | 15 |
| Gujarat | 0.280 | 16 |
| Uttar Pradesh | 0.269 | 17 |
| West Bengal | 0.257 | 18 |
| Tripura | 0.250 | 19 |
| Kerala | 0.226 | 20 |
Source : Author’s Analysis, CEEW Study on Climate Change Vulnerability and Index and District Level Risk Assessment
States that are not ranked:
Chhattisgarh, Goa, Haryana, Jharkhand, Madhya Pradesh, Meghalaya, Mizoram, Punjab, Tamil Nadu, Telangana, Uttarakhand, Andaman and Nicobar Islands, Chandigarh, Dadra and Nagar Haveli and Daman and Diu, Ladakh, Lakshadweep, Puducherry.

